The Many Faces of Good Experiments
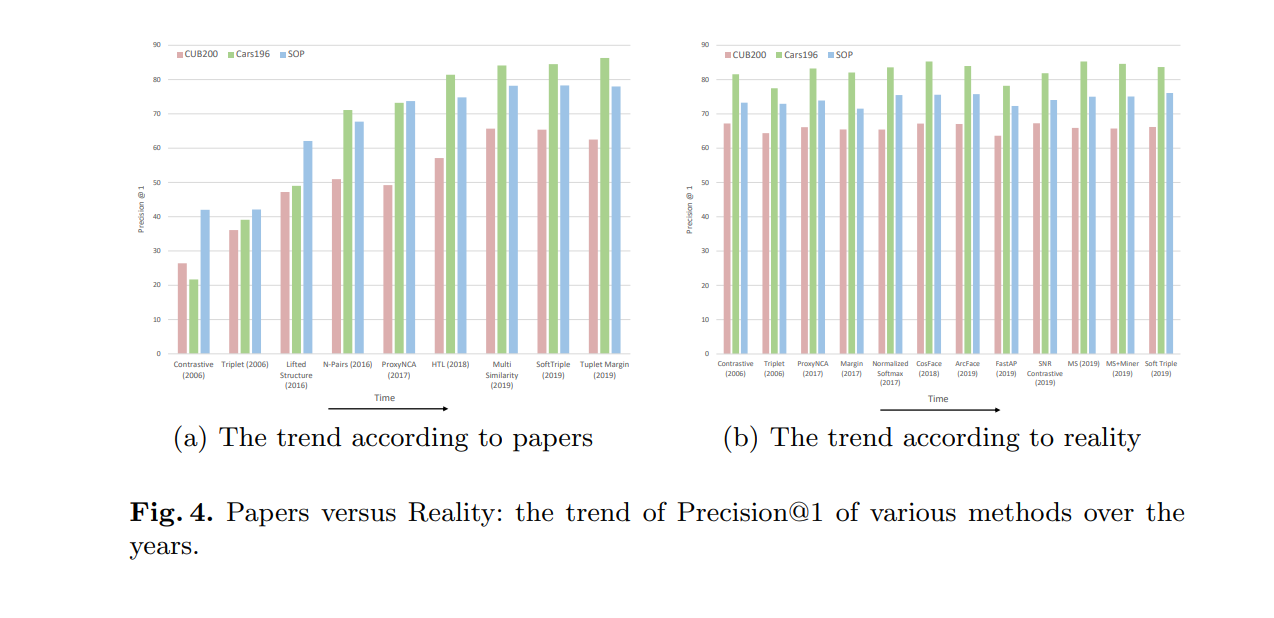 Image credit: (https://arxiv.org/abs/2003.08505)
It’s no big secret that machine learning suffers from a science problem. The issue, sometimes funny, always sad, is that it is difficult to rely upon many published results, despite monikers like “state-of-the-art” and “competitive”. A recent paper on the field of metric learning highlights, in a particularly acute manner (see the header image), the misleading impression of progress that results in the literature may give. Many papers suffer from the following: lack of statistical significance in results, too much focus on only one or a few metrics of performance, no substantive discussion of the failure cases of one’s new algorithm, and unfair comparisons to competitors in the literature.
My regret for the state of the field is not meant to imply that science should proceed linearly forward. Indeed, the trajectory of science is often fraught with deadends, backtracks, and strokes of chance. Unpromising avenues can end up revolutionizing the field, as happened with deep learning. It is unreasonable to ask that scientific practitioners establish unchanging truth with every paper, however much we may wish it so. It is similarly unreasonable to demand experimental perfection; we are, after all, imperfect beings with variable constraints on judgement, focus, and motivation. Nevertheless, we should expect some basic level of quality. Consistent output of results that have not been vetted to the best of one’s ability wastes time and research funding, both of which are quite limited. In a world with capped resources and almost unlimited problems, good science is a matter of moral urgency, especially given lower public trust in science and serious public health implications.
But I wonder about the precise standard we should be setting. I myself have many doubts in the course of my own research. Am I showing what I claim to be showing? How many trials is enough given that I have limited computational resources? How do I ensure that comparisons are fair, and what does fair even mean in this context? What metric should I use to define and compare performance?
In my main area of research, reinforcement learning, I have been thinking about how one should compare the performance of algorithms that each have different possible parameter settings. Different algorithms with different parameter settings generate separate learning curves, a time series that for each time point provides a measure of performance (i.e., the return achieved by the agent, in the case of reinforcement learning). The challenge is in summarizing the time series data into a compact set of numbers, preferably one number, for the purposes of (1) selecting a “best” configuration of parameters for a given algorithm and (2) comparing different algorithms. The complication is that selecting one summary statistic, such as the area under the curve, may yield final algorithm rankings that differ from those that result after selecting another summary statistic, like final return. Although one would preferably tailor the summary statistic to the intended application, it can be difficult to distinguish between competing measures; after all, what is the difference between the area under the last half of the curve and the area under the last 60% of the curve?
The complications compound once we have selected a summary statistic. We are also often interested in understanding the sensitivity of an algorithm to its parameters: as I vary the parameters of an algorithm, how does the performance, as measured by the summary statistic, vary? Does the algorithm only perform well with a very specific setting of parameters, or is it generally robust to many possible settings of the parameters? This question is important since practitioners may not have the time or computational resources for massive grid searches to find the best parameters. In reinforcement learning, it is customary (although not quite as customary as I would like) to provide sensitivity curves. Here is an example of one.
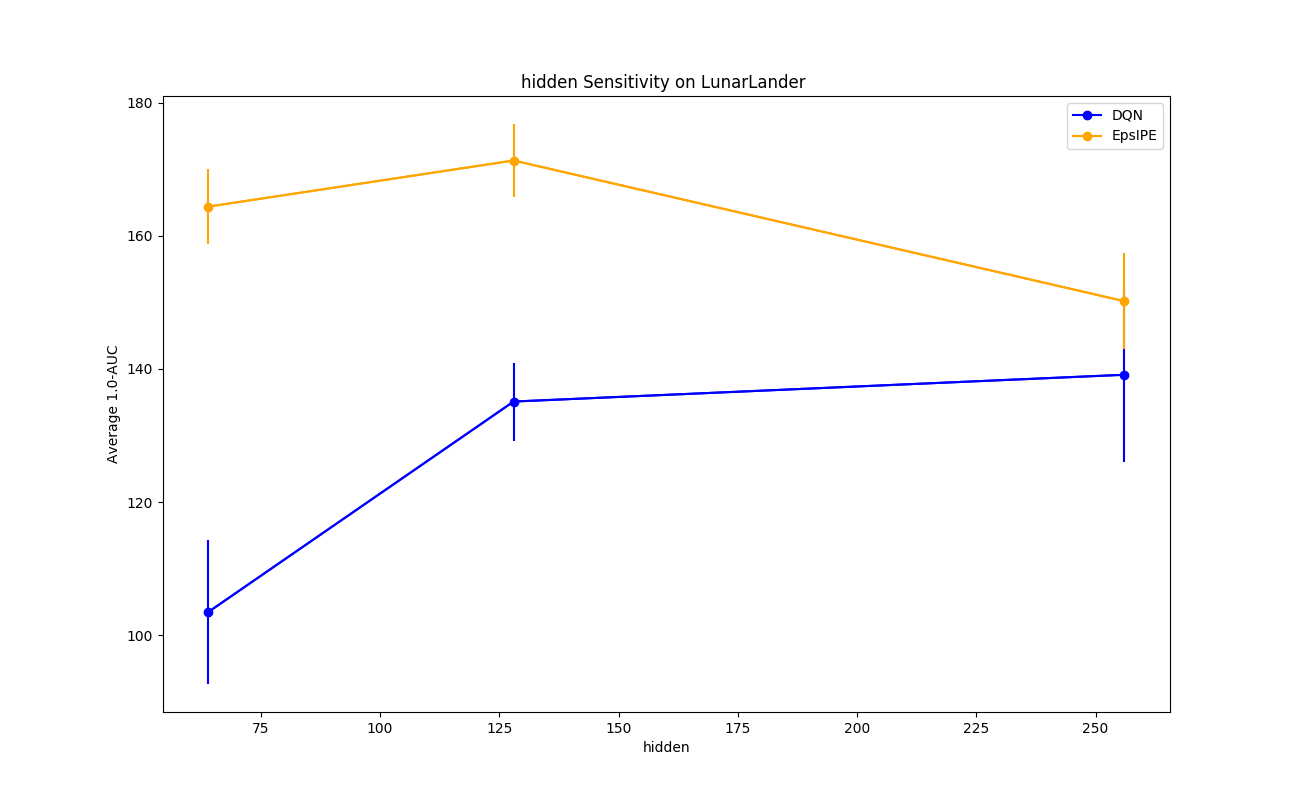
This figure provides sensitivity curves of a given parameter, which I call hidden, for two algorithms (DQN and EpsIPE). Here, I have selected the area under the curve as my summary statistic. I compare two algorithms based on the maximum of the areas under the curve of all the other parameter settings, fixing the parameter called hidden to a value given by the x-axis. Now, the catch is that I introduced another “second-order” summary statistic, the maximum, in plotting the curves; I need to summarize the performance not of one algorithm with one set of parameters, but also of the same algorithm over different sets of parameters. If I had chosen another second-order summary statistic, like the average, I would end up with different curves. One could imagine a variety of other choices for this second-order summary statistic, and a concomitant danger of cherry-picking a statistic to provide a more favourable impression of one’s own algorithm, to the detriment of one’s competitors and of science.
In a short section of his essay on modern art, José Ortega y Gasset remarked on the many faces of truth.
A great man is dying. His wife is by his bedside. A doctor takes the dying man’s pulse. In the background two more persons are discovered: a reporter who is present for professional reasons, and a painter whom mere chance has brought here. Wife, doctor, reporter, and painter witness one and the same event. Nonetheless, this identical event—a man’s death—impresses each of them in a different way. So different indeed that the several aspects have hardly anything in common. What this scene means to the wife who is all grief has so little to do with what it means to the painter who looks on impassively that it seems doubtful whether the two can be said to be present at the same event.
It thus becomes clear that one and the same reality may split up into many diverse realities when it is beheld from different points of view. And we cannot help asking ourselves: Which of all these realities must then be regarded as the real and authentic one? The answer, no matter how we decide, cannot but be arbitrary. Any preference can be founded on caprice only. All these realities are equivalent, each being authentic for its normal or most spontaneous. Thus we arrive at a conception of reality that is by no means absolute, but at least practical and normative.
There is a melancholic thread in Ortega y Gasset’s observation: try as we may to view the truth in its entirety, we can but glimpse it through the distortions of our own lenses. There is no way to “step outside”, to otherwise transcend this limitation, because the act of observation implies the existence of a subjective being who observes. Living relegates us to reconciling with this gulf in understanding.
Summary statistics are naturally different realities through which we may view the truth of the recorded data. It is not feasible to take in our mind’s eye this entirety; we are only human, and thus we must simplify. The problem extends itself into any scientific endeavour that requires the analysis of masses of data: from the minutest of interactions in particle colliders, to the reams of biological sequences in any organism. To understand such complexity, we must lie a little, distort the truth that we cannot fully comprehend. But we should be honest in our lies. Instead of reporting only one measure of performance, we should give several, along with the possible reasons for which one might select each in different circumstances. In the pursuit of truth, we should frankly and humbly recognize the limitations of our cognition, notwithstanding the myriad incentives to “move fast and break things”.
Acknowledgements
Thanks to Kevin Wang, Iara Santelices, and Rudra Patel for reading a draft of this piece.
Alan Chan
PhD Student
I work on AI governance as a Research Scholar at GovAI and a PhD student at Mila.